 Felipe Tavares
 At some point in every budget cycle, someone with spending authority asks the question in this title, more or less verbatim. The answers that come back decide headcount, and the traditional answers are terrible: reviews conducted, standards published, reference architectures produced, forums chaired. An inventory of activity, offered to a person who allocates money by outcomes. Functions that answer this way get cut, and the uncomfortable part is that cutting them is often the right call. A function that can only describe its activity has no evidence it produces anything else.
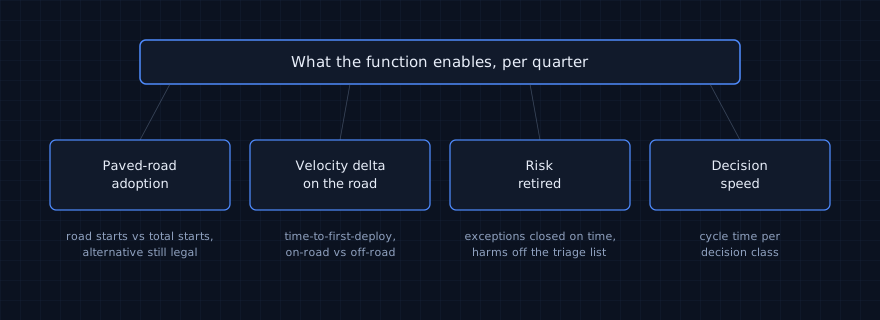
Here is a better answer, stated up front so the rest of the piece can defend it. An architecture function is worth what it enables, and enablement is measurable as four factors:
- how much of the estate voluntarily adopts the paved road;
- how much faster teams move on it;
- how much risk the function retires per quarter;
- how fast its decisions ship.
Each factor has an instrument you can build from data you already have. Together they price the function’s real product: other teams’ speed.
For the engineers reading: this model is your ally. A function measured on your velocity delta has incentives that finally point at you. Reviews that exist to feed a review count stop being scheduled, because review counts stop mattering. The road gets faster because the road’s speed is the score. When the architecture team’s number improves, something got better for you, by construction.
Why activity metrics get teams cut
Activity metrics fail twice. They fail as evidence, because a budget owner can’t convert “forty reviews” into any outcome they recognize, and what can’t be converted gets discounted to zero at allocation time. And they fail as incentives, because they get gamed instantly and in the worst direction: measure reviews held and reviews multiply; make document output the KPI and the wiki swells with pages nobody asked for; report compliance percentages and the function starts optimizing the number instead of the estate. Every one of those distortions makes engineers’ lives worse, which means the metric actively spends the function’s credibility with the people it exists to serve.
The deeper problem is what activity metrics say about self-understanding. A function that counts its reviews believes its product is reviews. The teams downstream already know better, and they notice before any budget committee does.
The model, factor by factor
Adoption of the paved road
What share of new services, pipelines and integrations chose the default path when a legal alternative existed. Voluntary adoption is the integrity condition for the whole model: a mandated road measures your enforcement budget, while a chosen road measures whether the defaults are actually good. Instrument: count road starts against total starts, per quarter, from your scaffolding and pipeline telemetry.
Velocity delta on the road
How much faster a team moves on the paved path than off it. Time-to-first-deploy is the cleanest probe: from repo creation to first production deployment, road versus off-road, same quarter. The delta is the function’s headline number, because it converts directly into the language budget owners allocate by. If the delta is zero, the road is decoration. If it’s negative, the function is charging teams for the privilege of compliance.
The delta demands honest handling, because it’s the number most worth gaming. Compare like cohorts: greenfield services against greenfield services, same quarter, same rough size. Publish the method next to the number. And leave the embarrassing outliers in, because the team that got stuck on the paved road for six weeks is information about the road. One quietly trimmed quarter costs the metric its audience permanently.
Risk retired
Governance’s defensive value, made countable without a compliance percentage. The feeds are records you likely already keep, or should: deviations from an exception ledger that closed on schedule rather than renewing forever, harms from a triage list fixed and gone, end-of-life surface removed. Report it as a list with dates: what was on the risk list last quarter and is off it now.
An exception ledger yields this factor’s sharpest single instrument: exception half-life, the time a time-boxed deviation actually lives before it closes or gets promoted. A shrinking half-life means the road is absorbing the cases that used to force exceptions. A growing one means the standards are drifting away from what teams need, and you’re reading that signal quarters before it would have surfaced as an incident.
Technical-debt reduction belongs in this factor as a named line, and it deserves better framing than housekeeping. Gartner’s research on technical debt (“Utilize Technical Debt as a Modernization Catalyst”, February 2025) makes the case for folding debt mitigation into the modernization roadmap itself: treat debt “as an opportunity instead of an obstacle”, and use each retirement to pull the estate toward its target state. Measured that way, a debt item closed counts twice in the same entry: risk retired and modernization advanced. That is a double count a budget owner will accept. The same research describes prevention in terms this series recognizes: “Ongoing technical debt accumulation can be greatly mitigated, if not preempted entirely, when doing something the right way is as easy as pulling it off a shelf.” That is the paved road, seen from the debt side. Your adoption factor is also your debt-prevention instrument, and the two lines belong side by side in the budget conversation.
Decision speed
Cycle time per decision class, from request to answer, measured once decision classes have named owners. Teams price this factor intuitively because they live in its queue. Finance prices it too once you translate: every week a decision waits is a week of engineer time spent on workarounds and re-planning around the gap.
Four factors, one composed statement: this quarter, the defaults were chosen this often, teams on them moved this much faster, this risk left the estate, and answers arrived this quickly. That is what an enablement function is worth, stated in a form that survives a budget meeting.
Present it simply and resist branding it. The moment the model becomes a certified framework with a trademark, it starts answering questions your organization never asked. It’s an instrument: point it at your estate and read.
The layer above and the layer below
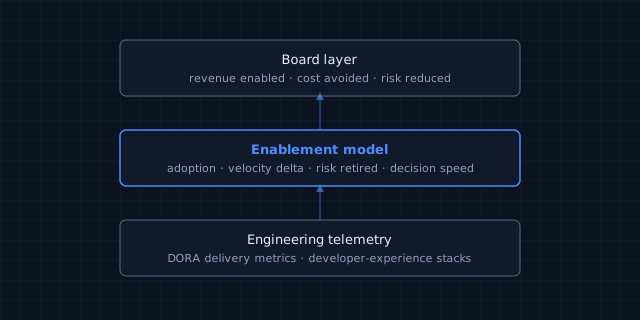
The model sits between two measurement layers, and it has to translate in both directions. Above it, the board layer speaks outcomes: revenue enabled, cost avoided, risk reduced. Gartner’s guidance on measuring enterprise architecture points the same way, toward outcome-driven metrics stated in business language. The four factors feed that layer honestly: velocity delta and adoption convert to delivery capacity, risk retired converts to exposure, decision speed converts to time-to-market. One translation, worked: if the road’s delta is four weeks and twenty services start on it in a year, the function returned over a year and a half of delivery capacity to the portfolio. That sentence is headcount grammar, the dialect budget meetings are conducted in.
Below it, the engineering layer already exists: DORA’s delivery metrics, and practitioner stacks like DX Core 4 for teams that want a packaged developer-experience view. The enablement model consumes that telemetry; it doesn’t replace it. Three layers, one story, no number appearing at a layer where its audience can’t act on it.
The vacuum this fills is documented. The State of Platform Engineering Vol. 4 reports that 29.6% of platform teams don’t measure success at all, and platform teams are the architecture function’s closest measurable cousins. Forrester’s 2026 predictions found fewer than a third of decision-makers able to tie AI’s value to their organization’s financial growth, with CFOs responding on cue. Functions adjacent to yours are walking into budget season unarmed. The ones that can show a velocity delta will be keeping their headcount.
What not to measure
Every measurement model becomes a weapon eventually, so this one ships with a safety:
- Measure the road, never the architects. Individual throughput metrics reproduce the review-count trap one level down and teach your best people to optimize for visibility.
- Skip document output entirely, in any form.
- Skip compliance percentages. They flatten what matters and reward the wrong work.
- Watch adoption for coerced conversions. The quarter someone quietly deletes the legal alternative, voluntary adoption becomes mandate wearing the old metric’s clothes.
The test for any proposed addition: does improving this number require making some engineer’s week better? If it can improve while their week gets worse, it doesn’t belong in the model.
Cadence is part of the safety too. Report quarterly. Enablement moves at the speed of adoption decisions and platform releases, and a weekly dashboard of these factors invites exactly the number-managing behavior the model exists to replace. The telemetry underneath can stay real-time; the worth statement should arrive with the seasons.
I’ve been close to a version of this discipline inside the central architecture function of a global enterprise, where governance KPIs were defined around technical-debt reduction and decision time: kinds of measures, never activity counts. The observable effect was on conversations. Budget discussions ran on evidence about what the function had retired and accelerated, and the activity inventory stopped being anyone’s opening argument. Qualitative, but the shift in genre is the point, and it travels.
Your first measurement
Instrument one factor. Take the last five services that started on your paved road and the last five that didn’t, and compute time-to-first-deploy for each set. Two spreadsheet columns, dates you already have in your repos and pipelines. The difference between the medians is your first velocity delta.
It will be rough and arguable. It is also the first sentence about your function’s worth that a budget owner can act on, and arguing about a delta beats defending a review count in any meeting you’ll attend this year. Next quarter, add adoption. The model composes one honest factor at a time.
Worth taking away:
- Enablement is measurable: adoption, velocity delta, risk retired, decision speed. Anything else you report should ladder into one of the four.
- Voluntary adoption is the integrity condition. The moment the road is mandatory, the number stops meaning anything.
- Translate in both directions: board language above, engineering telemetry below, and never show a number to an audience that can’t act on it.
- Protect the model from itself: no individual metrics, no document counts, quarterly cadence, and the engineer’s-week test for every addition.